
BenchmarkDotNet helps you to transform methods into benchmarks, track their performance, and share reproducible measurement experiments. Under the hood, it performs a lot of magic that guarantees reliable and precise results thanks to the perfolizer and pragmastat statistical engines. (source)
using System.Security.Cryptography;
using BenchmarkDotNet.Attributes;
using BenchmarkDotNet.Jobs;

[SimpleJob(RuntimeMoniker.Net80)]
[SimpleJob(RuntimeMoniker.Net10_0, baseline: true)]
public class Md5VsSha256
{
    private SHA256 sha256 = SHA256.Create();
    private MD5 md5 = MD5.Create();
    private byte[] data;

    [Params(1000, 10000)]
    public int N;

    [GlobalSetup]
    public void Setup()
    {
        data = new byte[N];
        new Random(42).NextBytes(data);
    }

    [Benchmark]
    public byte[] Sha256() => sha256.ComputeHash(data);

    [Benchmark]
    public byte[] Md5() => md5.ComputeHash(data);
}
Program.cs:
BenchmarkRunner.Run<Md5VsSha256>();
// BenchmarkSwitcher.FromAssembly(typeof(Program).Assembly).Run();
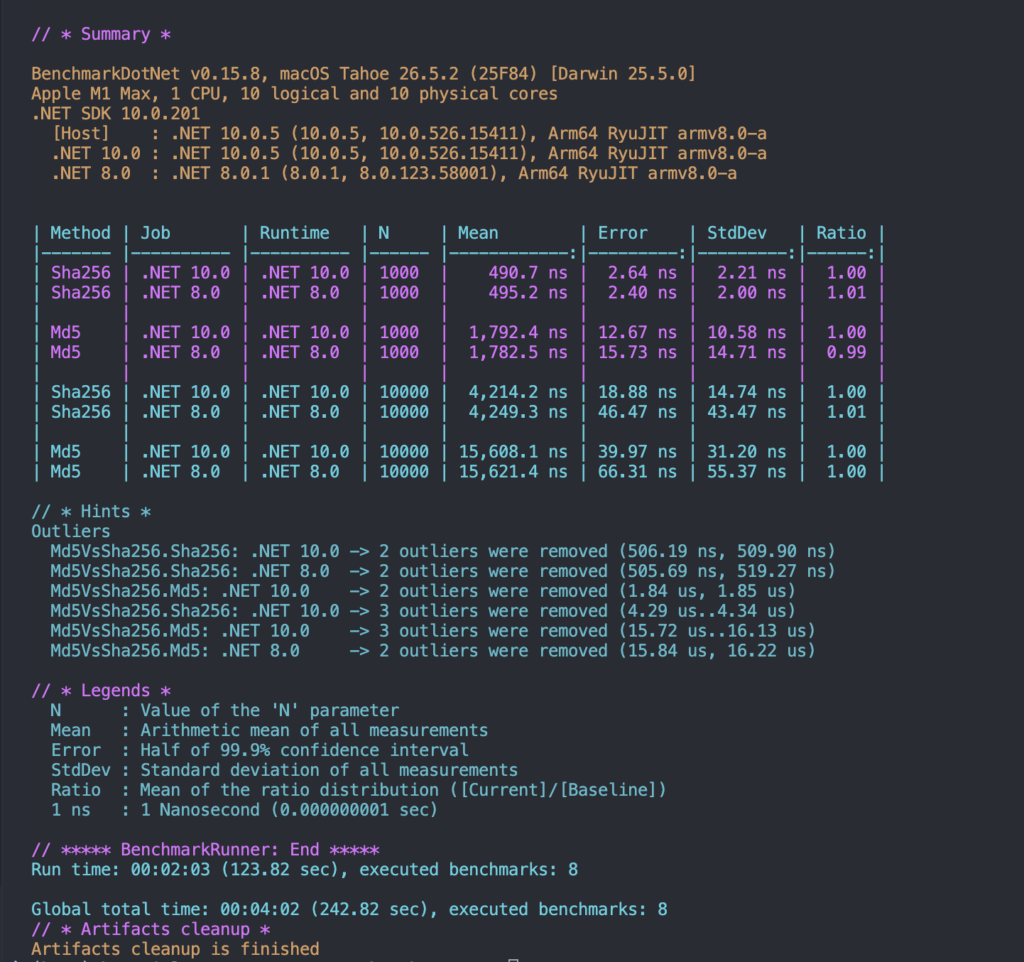
R installation required for [RPlotExporter] (it generates the plot)
How to Read Benchmark Report
| What it measures | How to read it | |
| Mean | Average time per single call | watch the unit. average execution time. |
| Error | Half of the 99.9% confidence interval | If Error is large relative to Mean, the measurement is noisy — don’t over-trust it. |
| StdDev | standard deviation across runs | small: stable method, large: each call varies (IO, GC, threads) |
| Ratio | Time relative to the baseline | key column for comparisons 1.00=baseline 2.00=twice as slow 0.50=twice as fast |
| RatioSD | Standard deviation of the ratio | Tells us how reliable the Ratio is. |
| Gen0 / Gen1 / Gen2 | GC collections (per 1000 ops) MemoryDiagnoser attribute required | High Gen0 = many short-lived allocations. Non-zero Gen1/Gen2 = longer-lived, costlier objects. |
| Allocated | Managed heap allocation per single call MemoryDiagnoser attribute required | - or 0 B = no allocation. Two methods at equal speed but different allocation → prefer the leaner one. |
Rule of thumb:
Read Ratio together with Error/StdDev.
Instead of “method X is faster,” think “method X is Y% faster than baseline, with low measurement noise.”
Job Run Strategies
| Throughput (default) | ColdStart | Monitoring | |
| Purpose | Measure steady-state performance of fast code | Measure first-call / cold cost (JIT, first allocation, cold cache) | Measure long-running, unstable operations |
| Pilot stage(*) a preparation phase that automatically finds how many times to call the method per iteration (InvocationCount). If a single call is too fast to measure, it repeats enough times to reach a meaningful total duration. | Runs — auto-determines invocation count | Skipped | Skipped |
| Warmup(*) unmeasured pre-runs executed before the real measurement so that “warming” effects (JIT compilation, CPU cache filling) settle and don’t pollute the results. | Runs | Skipped | Runs |
| Invocations per iteration | Many (thousands–millions), then averaged | 1 per iteration | Few, but fully measured |
| Typical use case | Algorithms, hot paths, micro-optimizations | Startup cost, JIT impact, first-hit latency | Integration tests, IO-heavy work, “different every time” scenarios |
- Throughput → fast, stable code (many repetitions + averaging)
- ColdStart → first-call cost (single run, no warmup)
- Monitoring → long, unstable work (few repetitions, no pilot)
[SimpleJob(RunStrategy.Throughput, baseline: true)]
[SimpleJob(RunStrategy.ColdStart, warmupCount: 0)]
[SimpleJob(RunStrategy.Monitoring)]
[MemoryDiagnoser]
public class RunStrategyDemo
{
    private readonly byte[] _data = new byte[1024];
    private readonly MD5 _md5 = MD5.Create();

    public RunStrategyDemo()
    {
        new Random(42).NextBytes(_data);
    }

    [Benchmark]
    public byte[] FastHash() => _md5.ComputeHash(_data);

    [Benchmark]
    public void SlowUnstableWork()
    {
        int ms = 100 + Random.Shared.Next(0, 40);
        Thread.Sleep(ms);
    }
}
JIT / Dead Code Elimination
When we need to benchmark the code, Project should be started in Release mode. Optimization will be done.
If the output isn’t used anywhere, the JIT eliminates the code, which skews the benchmark results.
PROBLEM:

[Benchmark]
public void Bad()
{
    Math.Sqrt(123.45); // constant folding & calculation result not used -> eliminated by JIT
}


SOLUTION:

[Benchmark]
public double Good() => Math.Sqrt(_input); // _input is not constant, calculation result returned
When the benchmark can’t return a value for the JIT to treat as used (e.g. it’s void), use the Consumer class from BenchmarkDotNet.Engines.
SOLUTION:
private Consumer _consumer = new();

[Benchmark]
public void Loop()
{
    foreach (var x in _items)
        _consumer.Consume(Work(x)); // .Consume(...) -> JIT assumes result is in use. there is no dead code
}
JIT / Lazy Evaluation
[SimpleJob]
public class ProcessorBenchmarks
{
    private Consumer consumer = new();

    // BAD: Compute() is called but the iterator is never walked.
    // yield return is never reached -> the actual work never runs.
    // Also the result is not consumed -> dead code elimination applies.
    // Benchmark only measures creating the iterator object, not the real work.
    [Benchmark]
    public void Bad()
    {
        Compute();
    }

    // TOARRAY: Runs correctly but pollutes the measurement.
    // ToArray() walks the iterator (lazy is triggered) BUT allocates a new array.
    // Now you measure Compute() + array allocation instead of just Compute().
    [Benchmark]
    public void ToArrayVersion()
    {
        Compute().ToArray().Consume(consumer);
    }

    // GOOD: Consume walks the iterator to the end.
    // Every yield return is triggered -> the work actually runs.
    // No extra ToArray()/ToList() allocation, so the measurement stays clean.
    [Benchmark]
    public void Good()
    {
        Compute().Consume(consumer); // lazy forced, no allocation
    }

    public IEnumerable<string> Compute()
    {
        yield return "OK";
    }
}
documentation: https://benchmarkdotnet.org/articles/guides/getting-started.html
source code: https://github.com/dotnet/BenchmarkDotNet
nuget: https://www.nuget.org/packages/benchmarkdotnet/