Traditional monitoring focus “is the infrastructure healthy?”
SRE reliability focus “is the user experience healthy?”
Infrastructure metrics such as CPU, memory, disk usage
confirm that servers are running and allow us to do capacity planning. But metrics don’t provide insight into user workflows.
Distinguishing between SLIs, SLOs and SLAs
| SLI – Service Level Indicator | SLO – Service Level Objective | SLA – Service Level Agreement |
| a quantitative measurement | target value or range of values | an explicit contract |
| as users experience it | measured by an SLI | guaranteeing a level of service |
| Example: Latency: 9985 / 10000 -> 99.85% | Example: Latency: 99.9% within 300ms Rolling 28-day window | Example: 99.9% uptime |
| internal commitments set by engineering team, agree with product team, drive operational decisions | When the SLAs decreased, providers may give extra credits for bills | |
| SLIs tell us what’s happening | SLOs tell us whether it’s good enough | SLAs tell our customers what we guarantee |
Critical User Journey (CUJ)
Critical user journeys define where to focus. It is a flow through our product that users depend on. There may be multiple steps touching multiple services. Any step failing or running slowly means the journey fails.
Selecting SLIs based on Service Type:
Service Type categories determine how to measure
| Request-driven | Data processing | Storage |
| APIs, web frontends, mobile backends | Batch jobs, ETL, message queues | Databases, object stores, file systems |
| Availability: successful responses Latency: successful responses within threshold | Freshness: currency of the data Correctness: completeness and accuracy Throughput: processing volume | Durability: data preserved without loss or corruption Availability: access requests processed |
Good Events Ratio:
Formula: Good events divided by total events, multiplied by a hundred
| Request Service | Data pipeline | Database | |
| Total Event Definition | The number of HTTP requests received | The number of records processed | The number of write operations |
| Good Event Definition | Successful response code from the service | Processing output verified correct | data persisted permanently to the store |
Choosing the event unit
| API | Async Service | Website |
| Request | Jobs, messages, or pipeline runs | Page Loads, user journeys |
Percentiles
| Definition | Represents | Typical Use Case | |
| p50 (median) | 50% of requests are faster than this value | The average or typical user experience | General health check of the system |
| p95 | 95% of requests are faster than this value, slowest 5% start here | The start of the tail – borderline acceptable performance | SLA targets, day-to-day performance monitoring |
| p99 | 99% of requests are faster than this value, slowest 1% start here | beyond acceptable – edge-case degraded experience | Detecting timeouts, GC pauses, overloaded servers, network issues |
Avoiding common measurement mistakes
| Mistake | Description | Impact |
| Measuring at the wrong layer | Relying solely on server-side metrics ignores everything that happens before a request even reaches the server | Misses DNS failures, TLS handshake errors, and dropped connections — parts of the journey where users silently fail |
| Treating all errors as the same | Not every failure carries the same weight | Transient failures with automatic retry vs uncaught exceptions which bubble up to the user |
| The streetlight effect | Teams tend to look where measurement is easiest, not where the problem actually is | Without a user-centric lens, dashboards can look “healthy” while real issues go undetected |
| Goodhart’s law | The metric becomes the target | Teams optimize to improve the number instead of the underlying user experience |
| Including noise in the signal | Automated health checks run constantly and usually succeed | Mixing them with real traffic dilutes and distorts the true user-facing success rate |
| Undocumented SLIs | If the choice of metric, thresholds, and filtering logic isn’t written down | No one can trace how or why the SLI has changed over time |
| Carving SLIs in stone | User expectations and service implementations keep evolving | SLIs should not remain static |
The cost of extra nines in SLO
downtime allowed per 28-day window (40,320minutes)
| 99% | 6 hours, 43 minutes | 1% downtime allowed 40320 * 0.01= 403.2 minutes |
| 99.9% | 40.3 minutes | 0.1% downtime allowed 40320 * 0.001 = 40.32 minutes |
| 99.99% | 4 minutes | 0.01% downtime allowed 40320 * 0.0001 = 4.032 minutes |
| 99.999% | 24.2 seconds | 0.001% downtime allowed 40320 * 0.00001 = 0.4032 minutes |
Less room for risk – more time on process and ceremony.
(change board, Go/no go, War-room watch, rollback plan… organizational cost increase)
Dependency Ceiling:
SLO ceiling is the combined availability of all critical dependencies — not just our weakest link, but the product of all of them.
Let’s say we have 4 APIs dependent each other, each API has 99.9% availability.
What is the system availability SLO?
99.9 * 99.9 * 99.9 * 99.9 ≈ 0.996006
Availability -> 99.6%
Dashboard Design
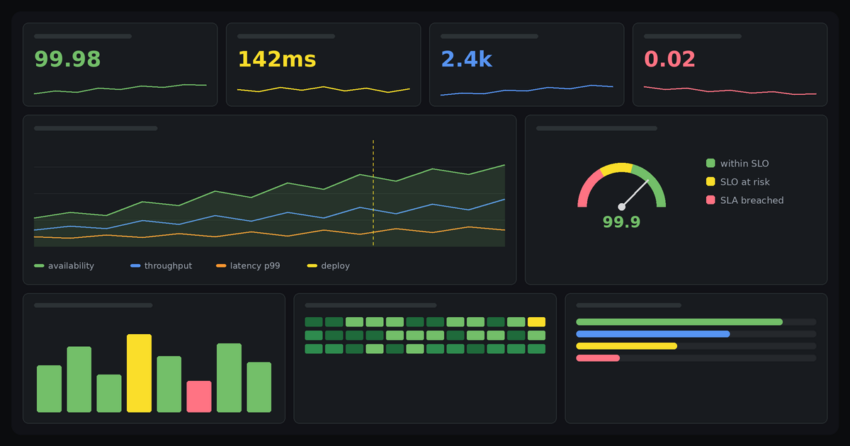
Instead of overcrowding dashboards with every metric, we must be selective and design dedicated dashboards for each target audience.
| Engineers | Managers | Executives |
| Current operational detail and debugging context for incidents | Trend analysis showing improvement or degradation over time | Business impact, commitments met, and investment priorities |
| Current SLI, detail to check incident | weekly or sprint-wised report | quarterly report, they need to see status of commitment and requirement of investment. |
SLO adoption roadmap
| 01-Measure | 02-Target | 03-Visualize | 04-Act |
| Define SLIs that reflect actual user experience | Set SLOs the team can defend with data | Dashboards by audience-engineers, managers, leadership | Burn-rate alerts, sprint planning & postmortems by impact |
| Pick a critical user journey, define its SLIs, instrument the good-events ratio | Mine historical data, remove genuine outliers, set an SLO below current performance with headroom | Deploy burn-rate alerts, build role-specific dashboards (engineers / managers / execs) | Activate the error budget policy, set review cadence, close the feedback loop |
SRE adoption is an iterative practice, not a one-time project